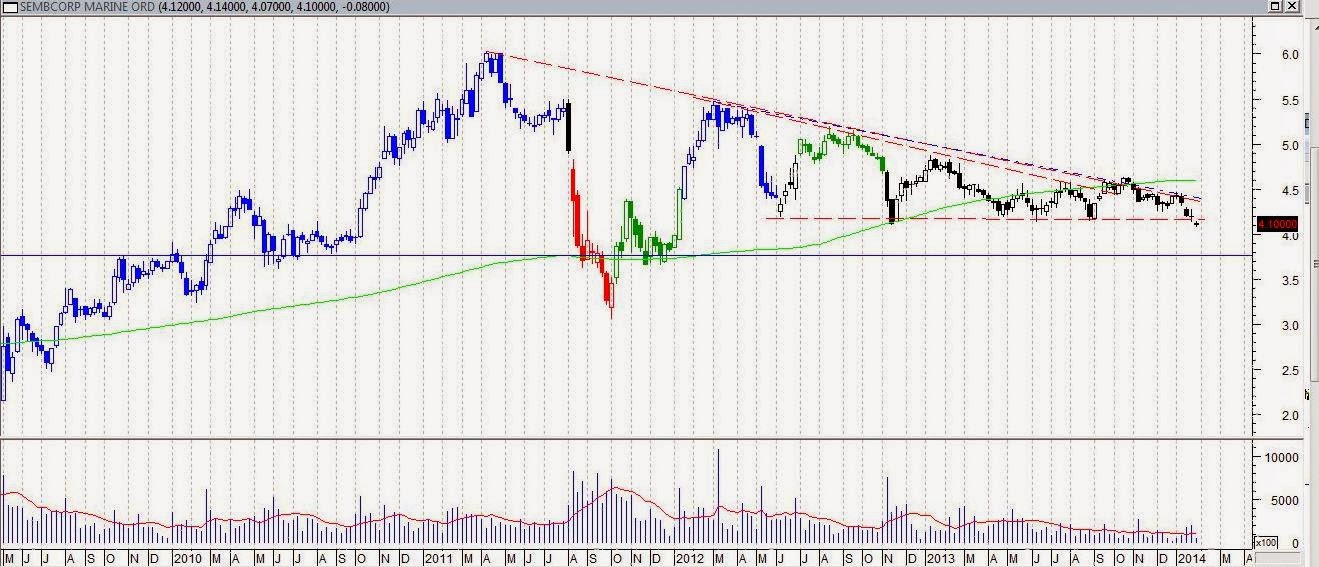
This is probably the biggest chart pattern among all the component stocks of the STI. Finally we see a break of the descending triangle on the down side. There was some sort of a false breakout back in Oct 2013. But price very quickly went back into the consolidation area again. Looks like more downside from here till about $3.75 region. Not too sure whether the $4.00 will prove to be a strong psychological level.
If look at the SembMar weekly chart, one will have some idea of how big this chart pattern is. I was just surprised that it choose to break down almost at the end of the apex of the triangle, and not any earlier. It take patience I guess.
Now give me a meaningful throwback, and I will short it!

No comments:
Post a Comment